Keeping an eye on your Mac’s CPU usage can help you spot performance issues and manage resources effectively. You can easily view CPU activity using the built-in Activity Monitor app on your Mac. This tool shows you which apps and processes are using the most processing power.
To check CPU usage quickly, open Activity Monitor and click the CPU tab. You’ll see a list of all running processes and how much CPU each is using. For a quick glance, you can also display CPU usage in your Dock. This puts a handy graph right where you can see it without opening any apps.
| Method | Steps | Difficulty |
|---|---|---|
| Activity Monitor | Open app, click CPU tab | Easy |
| Dock Icon | Right-click Activity Monitor, select Show CPU Usage | Very Easy |
| Menu Bar | Use third-party app | Moderate |

Checking Your Mac’s CPU Usage: A Multi-Method Approach
Want to keep an eye on how hard your Mac’s processor is working? There are several ways to check your CPU usage, each offering a different level of detail:
1. Activity Monitor: Your Go-To Tool
Activity Monitor is a built-in macOS utility that provides a wealth of information about your Mac’s performance, including CPU usage. Here’s how to use it:
- Open Activity Monitor: You can find it in Applications > Utilities > Activity Monitor.
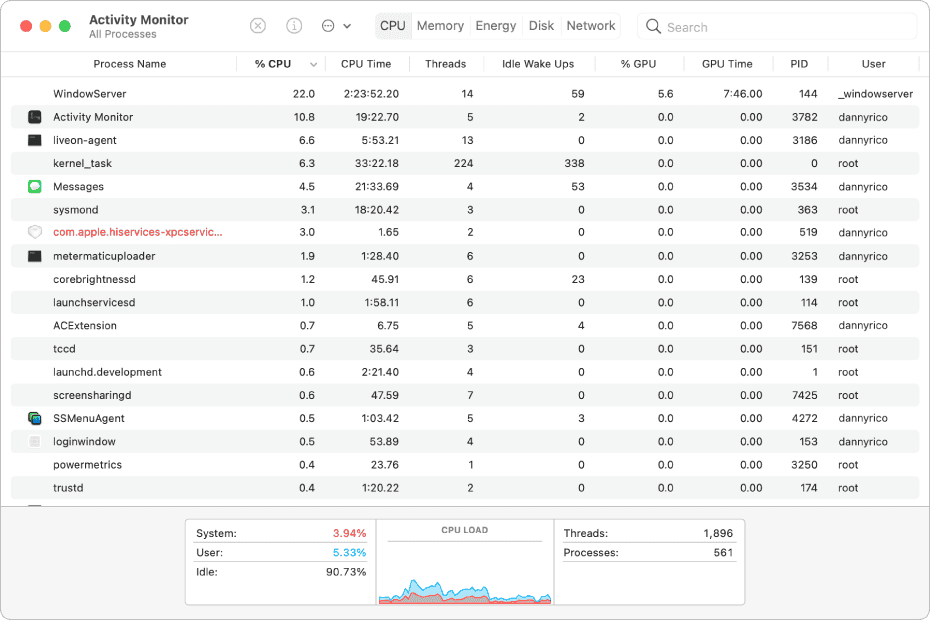
- CPU Tab: Click on the “CPU” tab to see a list of all running processes and their CPU usage.
- % CPU Column: The “% CPU” column shows how much of your CPU’s capacity each process is currently using.
- CPU Usage History: To see a graph of CPU usage over time, click Window > CPU History.
- Dock Icon: For a quick overview, you can enable the Activity Monitor dock icon to display CPU usage. Go to View > Dock Icon and choose how you want the CPU usage to be displayed.
2. Terminal: For the Command-Line Savvy
If you’re comfortable with the command line, you can use the top command in Terminal to view CPU usage in real-time.
- Open Terminal: Find it in Applications > Utilities > Terminal.
- Type
topand press Enter: This will display a list of running processes and their CPU usage, memory usage, and other information. - Press
qto quittop.
3. Third-Party Apps: More Features and Customization
Several third-party apps offer more advanced CPU monitoring features and customization options. Some popular choices include:
- iStat Menus: This app displays a variety of system information in your menu bar, including CPU usage, memory usage, network activity, and more.
- MenuMeters: Another menu bar app that provides customizable displays of CPU usage, memory usage, disk activity, and network activity.
Understanding CPU Usage
- System vs. User: Activity Monitor and
topwill show CPU usage divided into “System” (used by macOS) and “User” (used by apps you’ve opened). - High CPU Usage: If your CPU usage is consistently high, it could indicate that a particular app is consuming excessive resources or that your Mac is struggling to keep up with your demands. Try closing unnecessary apps or restarting your Mac to see if that helps.
- Spikes in CPU Usage: Occasional spikes in CPU usage are normal, especially when you’re performing demanding tasks like video editing or gaming.
Optimizing CPU Performance
- Close Unused Apps: Quit apps you’re not actively using to free up CPU resources.
- Limit Browser Tabs: Having too many browser tabs open can consume significant CPU resources.
- Manage Startup Items: Prevent unnecessary apps from launching at startup to reduce CPU load. Go to System Settings > General > Login Items to manage these.
- Update Your Software: Keep your macOS and apps up-to-date to ensure optimal performance.
- Restart Regularly: Restarting your Mac occasionally can help clear temporary files and improve performance.
By monitoring your CPU usage and understanding what’s normal, you can identify potential performance issues and take steps to keep your Mac running smoothly.
Beyond CPU Usage: Monitoring Other System Resources
While CPU usage is an important indicator of your Mac’s performance, it’s not the only factor to consider. You can also use Activity Monitor and other tools to monitor other system resources, such as:
- Memory: Check how much RAM your apps are using.
- Energy: See which apps are consuming the most energy.
- Disk Activity: Monitor read and write operations on your hard drive or SSD.
- Network: Track your network usage and identify any bandwidth-intensive apps.
By keeping an eye on these various system resources, you can gain a more comprehensive understanding of your Mac’s performance and identify any potential bottlenecks or issues.
Understanding CPU Usage on Mac
CPU usage on Mac directly impacts system performance and efficiency. Monitoring and interpreting this data helps identify bottlenecks and optimize your Mac’s operation.
The Role of CPU in Mac Performance
The CPU (Central Processing Unit) is the brain of your Mac. It handles calculations and executes instructions for all running programs. Your Mac’s CPU divides its power among active processes.
CPU usage shows how hard your processor is working. High usage can slow down your Mac. Low usage means your system has spare capacity.
To check CPU usage, open Activity Monitor. Select the CPU tab to see a list of active processes. The graph at the bottom displays overall CPU load.
Activity Monitor lets you view detailed CPU information. You can identify which apps use the most processing power.
Interpreting CPU Load and Capacity
CPU load represents the work your processor is doing. It’s shown as a percentage of total capacity.
Here’s a quick guide to interpreting CPU usage:
| CPU Usage | Interpretation |
|---|---|
| 0-30% | Light load |
| 30-70% | Moderate load |
| 70-100% | Heavy load |
System and User percentages show how CPU resources are allocated. System processes are essential for your Mac’s operation. User processes are apps you’ve opened.
High CPU usage by a single app may indicate a problem. You can force quit resource-hungry apps to free up CPU capacity.
Regular monitoring helps you spot unusual CPU activity. This can reveal malware or failing hardware. Keep an eye on your Mac’s CPU usage to maintain optimal performance.
Monitoring CPU Activities With Activity Monitor
Activity Monitor is a powerful tool for Mac users to track CPU usage. It provides detailed insights into system processes and helps manage resource-intensive applications.
Exploring the Activity Monitor Interface
To view CPU activity on your Mac, open Activity Monitor from the Applications > Utilities folder. The main window displays a list of all running processes. At the bottom, you’ll see a graph showing overall CPU usage.
The CPU tab offers several columns:
- % CPU: Shows how much processing power each app uses
- Time: Indicates how long a process has been running
- Threads: Displays the number of active tasks for each process
You can customize the view by adding or removing columns. Right-click on the column header to select which information to display.
Identifying Processes and CPU Usage Metrics
Activity Monitor categorizes processes into system and user types. System processes are essential for your Mac’s operation. User processes are apps you’ve opened.
To sort processes by CPU usage:
- Click the % CPU column header
- The highest consumers will appear at the top
Pay attention to processes using high percentages of CPU. They may cause your Mac to slow down or overheat.
The Activity Monitor Dock icon can show real-time CPU status. To enable this:
- Go to View > Dock Icon
- Select Show CPU Usage
This creates a quick visual reference without opening the full app.
Managing and Quitting Unresponsive Applications
When an app becomes unresponsive, Activity Monitor can help you force quit it:
- Select the problematic process in the list
- Click the “X” button in the toolbar
- Choose “Force Quit” in the pop-up dialog
For stubborn apps, use the Sample process feature:
- Select the process
- Click “Sample” in the toolbar
- Review the report to identify issues
Remember, force quitting may result in unsaved work loss. Use this option as a last resort.
| Action | Steps |
|---|---|
| Open Activity Monitor | Applications > Utilities > Activity Monitor |
| Sort by CPU usage | Click % CPU column header |
| Force quit an app | Select process > Click “X” > Choose Force Quit |
| Sample a process | Select process > Click “Sample” |
By using these features, you can keep your Mac running smoothly and identify resource-hungry applications quickly.
Optimizing CPU Usage on macOS
Effective CPU management on macOS can boost your Mac’s performance. These techniques help reduce strain on your processor and improve overall system responsiveness.
Handling High CPU Usage by Background Processes
To tackle high CPU usage, start by opening Activity Monitor. Sort processes by CPU usage to identify resource-hungry apps. Quit unnecessary apps or force quit unresponsive ones.
For persistent issues, restart your Mac. This clears temporary files and refreshes system processes. If problems continue, try safe mode to disable third-party software.
Update your apps and macOS regularly. Outdated software can cause CPU spikes. Check for updates in the App Store or directly from developers’ websites.
Consider uninstalling rarely used apps. They might run background processes that eat up CPU power. Remove them through Launchpad or Finder.
| Action | Benefit |
|---|---|
| Quit unused apps | Frees up CPU resources |
| Update software | Improves efficiency |
| Uninstall unnecessary apps | Reduces background processes |
Adjusting Dock and Spotlight for Better Performance
Customize your Dock to improve CPU efficiency. Right-click the Dock and select Dock Preferences. Turn off unnecessary animations and auto-hide features.
Limit the number of apps in your Dock. Too many can slow down your system. Remove unused apps by dragging them out of the Dock.
Optimize Spotlight indexing to reduce CPU load. Open System Preferences and click on Spotlight. Exclude folders you don’t need indexed.
Disable live previews in Dock. These constant updates can tax your CPU. Go to System Preferences > Dock and uncheck “Show recent applications in Dock.”
Utilizing Widgets and Third-Party Tools
Widgets can help you monitor CPU usage without opening Activity Monitor. Add the CPU widget to your Notification Center for quick checks.
Try iStat Menus for detailed system monitoring. It displays CPU usage in your menu bar and offers in-depth performance data.
Use Activity Monitor’s Dock icon to show CPU usage. Click View > Dock Icon > Show CPU Usage. This gives you a live graph without opening the full app.
Consider CleanMyMac X for system optimization. It can remove unnecessary files and optimize your Mac’s performance with a few clicks.
Set up automated maintenance tasks. Use macOS’s built-in maintenance scripts or third-party apps to clean up your system regularly without manual intervention.
Advanced Tips for Managing System Performance
Optimizing your Mac’s performance involves more than just monitoring CPU usage. You can enhance system efficiency by keeping tabs on disk space and analyzing CPU history trends.
Monitoring Disk Usage and Disk Space
Checking disk usage regularly helps prevent storage-related slowdowns. Use Disk Utility or third-party apps to scan your drive. Delete unnecessary files and move large items to external storage.
Clear your desktop of excess files. A cluttered desktop can slow down your Mac. Empty the Trash and Downloads folder often. Consider using cloud storage for less-used files.
Uninstall unused apps to free up space. Many apps leave behind support files after deletion. Use dedicated uninstaller tools for a thorough cleanup.
| Task | Benefit |
|---|---|
| Clear desktop | Improves startup time |
| Empty Trash | Frees up space |
| Uninstall apps | Removes clutter |
Interpreting and Utilizing CPU History
CPU history graphs in Activity Monitor show performance over time. Look for patterns in high usage periods. Identify which apps cause spikes.
Use this data to schedule resource-heavy tasks. Run demanding processes when your system is typically less busy. This improves overall responsiveness.
Set up automated maintenance tasks. Use tools like CleanMyMac or OnyX to clear caches and perform system optimizations on a schedule. This keeps your Mac running smoothly without constant manual intervention.
Consider upgrading hardware for persistent high CPU usage. More RAM or an SSD can significantly boost performance on older Macs.
Frequently Asked Questions
Mac users often need to monitor CPU usage for optimal performance. The Activity Monitor provides essential insights into system resources. Here are common questions about tracking CPU activity on macOS.
How can I monitor my CPU usage in the Activity Monitor on a Mac?
Open Activity Monitor from the Applications > Utilities folder. Click the CPU tab at the top. You’ll see a list of processes and their CPU usage. The bottom pane shows overall CPU percentages for System and User tasks.
What steps are required to display CPU usage in the Mac menu bar?
Install a third-party app like iStat Menus or MenuMeters. These tools add CPU usage indicators to your menu bar. They offer customizable displays and real-time updates of processor activity.
Are there any keyboard shortcuts for accessing the Activity Monitor on a Mac?
There’s no default keyboard shortcut for Activity Monitor. You can create a custom shortcut in System Preferences > Keyboard > Shortcuts. Add Activity Monitor and assign your preferred key combination.
Why might the CPU percentage exceed 100 in the Mac Activity Monitor?
CPU percentages over 100% indicate multi-core usage. Modern Macs have multiple cores. Each core can reach 100%, so total usage may exceed 100% when several cores are active simultaneously.
How can I view both CPU and GPU usage stats on my Mac?
Activity Monitor shows both CPU and GPU info. Select CPU or GPU from the top menu. For GPU, click Window > GPU History. This displays real-time graphs of processor and graphics card activity.
Where can I find detailed information about my Mac’s processor model and specifications?
Click the Apple menu > About This Mac. This shows basic CPU info. For more details, click System Report. The Hardware section lists your processor model, speed, and core count.
| Tool | CPU Info | GPU Info | Menu Bar Display |
|---|---|---|---|
| Activity Monitor | Yes | Yes | No |
| iStat Menus | Yes | Yes | Yes |
| System Report | Detailed specs | Basic info | No |


