
Safari’s Web Inspector lets you examine web pages on macOS. It’s a handy tool for web developers and curious users alike. To use Web Inspector, you need to turn it on in Safari’s settings.
Once enabled, Web Inspector opens up a world of web page details. You can see the HTML, CSS, and JavaScript that make up a page. This tool helps you find bugs, test designs, and learn how websites work.
Web Inspector is easy to use. Right-click on any part of a web page and select “Inspect Element.” A new window pops up with all the page’s code. You can change things and see the results right away on the page.
Safari’s Arsenal of Inspection Tools
Opening the Develop Menu
To harness Safari’s developer tools, you first need to activate the “Develop” menu. Navigate to Safari > Preferences > Advanced and check the box next to “Show Develop menu in menu bar.” This unlocks a suite of tools designed to enhance your web development workflow.
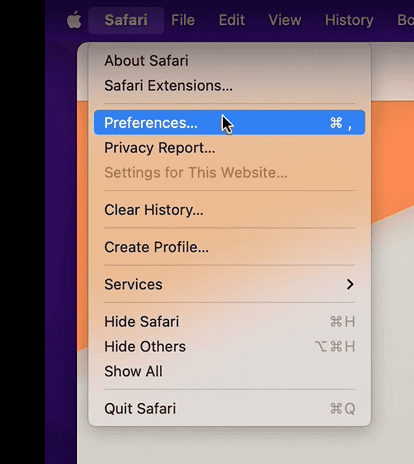
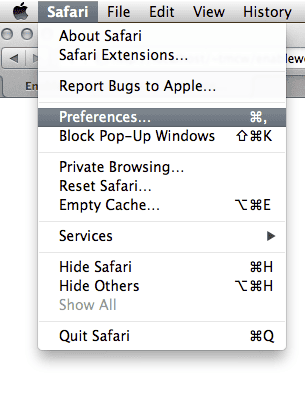
1. Click Preferences In The Safari Menu
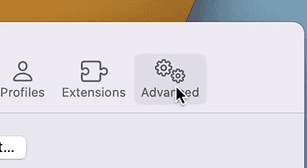
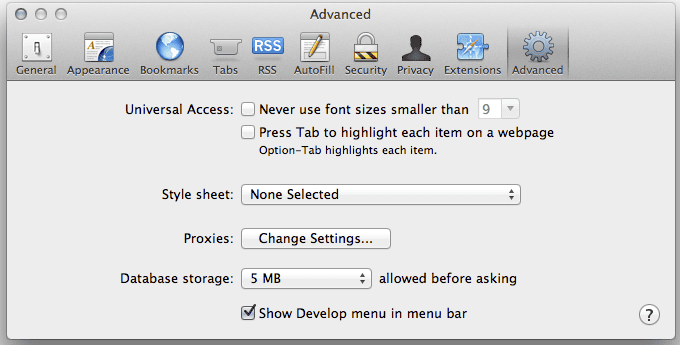
2. Click the Advanced Tab
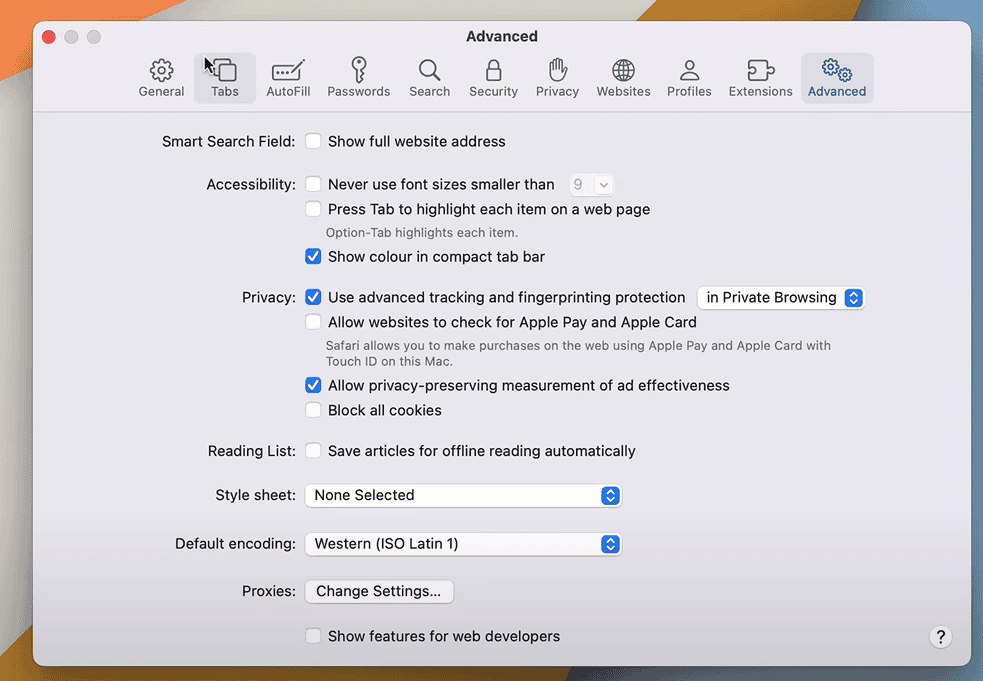
3. Check Show Features For Web Developers

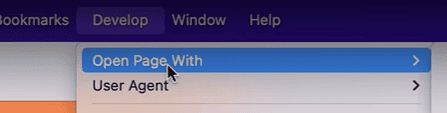
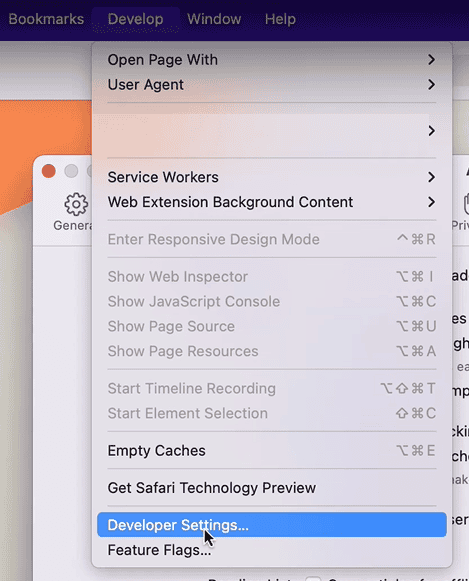
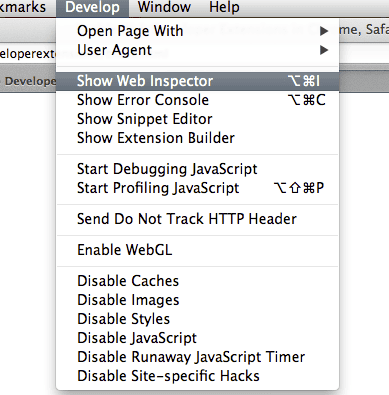
4. The Develop Menu Will Show
Inspecting Elements with Precision
The “Inspect Element” tool is your gateway to understanding a webpage’s structure. Right-click on any element and choose “Inspect Element.” A panel will appear, displaying the HTML, CSS, and JavaScript code responsible for that element’s appearance and behavior.
Debugging JavaScript Code
Safari’s JavaScript console is essential for identifying and fixing errors in your code. Use the console to log messages, inspect variables, and step through your code’s execution. You can access the console from the Develop menu or by pressing Option + Command + C.
Monitoring Network Activity
The Network tab in Safari’s developer tools provides a detailed view of all network requests made by a webpage. This can help you diagnose performance bottlenecks, identify slow-loading resources, and optimize your website’s loading speed.
Responsive Design Testing
Safari’s responsive design mode allows you to simulate different screen sizes and devices to ensure your website looks and functions correctly across a wide range of platforms. This feature is invaluable for creating responsive websites that adapt to various screen resolutions.
Additional Developer Tools
| Tool | Description |
|---|---|
| Storage | Inspect and manage website data stored in cookies, local storage, and session storage. |
| Timelines | Analyze the performance of a website’s rendering, scripting, and layout processes. |
| Layers | Visualize the layers of a webpage and identify rendering issues. |
| Resources | View and edit the resources (images, fonts, etc.) used by a webpage. |
| Console | View JavaScript logs, warnings, and errors. |
| Search | Search through the HTML, CSS, and JavaScript code of a webpage. |
| Debugger | Step through JavaScript code, set breakpoints, and inspect variables. |
| Network | Monitor network activity, including requests and responses. |
| Elements | View and edit the HTML and CSS of a webpage. |
| Responsive Design | Simulate different screen sizes and devices. |
| Performance | Analyze website performance and identify areas for improvement. |
| Memory | Monitor memory usage and detect memory leaks. |
| Security | View security details of a website, including certificates and connection information. |
| Audits | Get suggestions for improving website accessibility, performance, and SEO. |
| Web Inspector Extensions | Extend the functionality of Safari’s developer tools with custom extensions. |
Key Takeaways
- Safari’s Web Inspector must be turned on in settings
- Web Inspector shows the code behind web pages
- You can use Web Inspector to test and learn about websites
Enabling Web Inspector in Safari
Web Inspector is a powerful tool for examining web pages in Safari. It lets you view code and debug issues.
The keybinding is: ⌘⌥i
Show Develop Menu in Menu Bar
To use Web Inspector, you need to turn on the Develop menu first. Open Safari and click Safari > Preferences in the top menu bar. Click the Advanced tab. Check the box next to “Show Develop menu in menu bar.”
The Develop menu will now appear in Safari’s menu bar. This menu has many useful options for web developers.
Accessing Web Inspector Features
Once the Develop menu is visible, you can open Web Inspector. Go to the web page you want to check. Click Develop > Show Web Inspector in the menu bar. You can also use the keyboard shortcut Option + Command + I.
Another way to open Web Inspector is to right-click on any part of a web page and select “Inspect Element.” This opens the inspector and focuses on that specific element.
Web Inspector has several tabs with different tools. The Elements tab shows the page’s HTML structure. The Console tab displays JavaScript output and errors. Other tabs help you check network activity, storage, and more.
Utilizing Web Inspector for Development
Web Inspector is a powerful tool for developers working with Safari on macOS. It lets you look at and change webpage code right in the browser.
Inspecting and Modifying HTML and CSS
Web Inspector shows a page’s HTML and CSS. You can see how elements are nested and styled. Click any element to view its details. You can edit CSS properties live to test changes. This helps fix layout issues fast.
The Elements tab displays the page structure. It shows HTML tags and attributes. You can expand and collapse sections to focus on specific parts. Double-click text to edit content directly.
The Styles pane shows CSS rules for the selected element. You can turn rules on and off or change values. New styles can be added to test ideas quickly. These changes are temporary and reset when you reload the page.
Debugging and Troubleshooting
Web Inspector helps find and fix code problems. The Console tab shows errors warnings and logs. You can run JavaScript commands here to test ideas.
The Sources tab lets you set breakpoints in your code. This pauses execution so you can step through line by line. You can watch variables and see how values change as the code runs.
The Network tab shows all resources loaded by the page. This includes images scripts and data files. You can see load times and file sizes. This helps spot performance issues.
Advanced Web Inspector Tools
Web Inspector has tools for deeper analysis. The Storage tab shows data saved by the site like cookies and local storage. You can view and edit this data.
The Timelines tab records page activity over time. It shows when scripts run and layouts update. This helps find slow parts of your code.
The Layers tab visualizes the page’s composited layers. This is useful for spotting rendering issues. You can see how elements are stacked and repainted.
These tools give developers a complete view of their web pages. They make it easier to build fast and bug-free sites.
Safari includes built-in developer tools – you don’t need to install anything to debug issues in the browser.